Supported data formats
ctaplot is not tight to a specific data format as most functions accept arrays as input.
However, gammaboard reads results directly from HDF5 files. Two file structures are currently supported:
GammaBoard file format
Datasets in the HDF5 file are tables that can be opened with
pandas.read_hdf(filename, key=dataset_name)
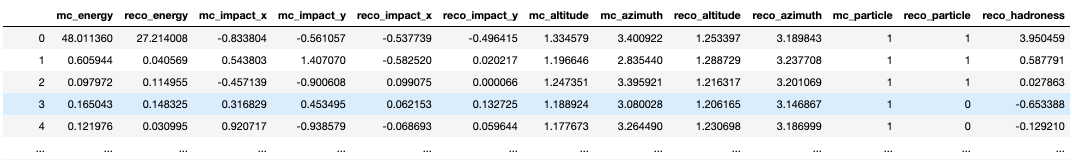
data - mandatory
Contains the reconstructed values
Columns names:
`mc_energy`: float
`reco_energy`: float
`mc_impact_x`: float
`mc_impact_y`: float
`reco_impact_x`: float
`reco_impact_y`: float
`mc_altitude`: float
`mc_azimuth`: float
`reco_altitude`: float
`reco_azimuth`: float
`mc_particle`: int 0 or 1
`reco_particle`: int 0 or 1
`reco_hadroness` or `reco_gammaness`: float between 0 and 1
triggered_events - optional
Single column table containing the list of triggered events energies:
Column name:
`mc_trig_energies`
simuluation/run_config - mandatory to plot the effective area
Contains the simulation information from each simulation file used (1 file per line):
Column names:
`energy_range_max`
`energy_range_min`
`max_alt`
`max_scatter_range`
`min_alt`
`num_showers`
`shower_reuse`
`spectral_index`
lstchain DL2 file format
As generated by lstchain>=v0.6
Datasets:
dl2/event/telescope/parameters/LST_LSTCam
Contains the reconstructed values
Column names: same as the GammaBoard format (see above) OR :
`mc_alt`: float
`mc_az`: float
`mc_core_distance`: float
`mc_core_x`: float
`mc_core_y`: float
`mc_energy`: float
`mc_h_first_int`: float
`mc_type`: : int following the simtel convention: 0 for gamma, 1 for electron, 101 for protons
`mc_x_max`: float
`reco_energy`: float
`reco_src_x`: float
`reco_src_y`: float
`reco_alt`: float
`reco_az`: float
`reco_type`: int following the simtel convention: 0 for gamma, 1 for electron, 101 for protons
`gammaness`: float between 0 and 1
simulation/run_config - mandatory to plot the effective area
Contains the simulation information from each simulation file used (1 file per line):
Column names:
`energy_range_max`
`energy_range_min`
`max_alt`
`max_scatter_range`
`min_alt`
`num_showers`
`shower_reuse`
`spectral_index`
Note: in the future, ctaplot will support the official CTA DL1 and DL2 file formats.
GammaBoard experiments directory structure
GammaBoard loads experiments data from a single directory where all experiments are stored You may want to export the path to this directory as:
GAMMABOARD_DATA=path_to_the_data_directory
In this directory, each sub-directory is an experiment containing:
experiment_name.h5 : Mandatory - file containing the reconstructed quantities as described above.
experiment_name.json : Optional - file containing information regarding the experiment. It can be anything compliant with the json format.
Example of GAMMABOARD_DATA directory
GAMMABOARD_DATA
    ├── exp_01
    |    ├── exp_01.h5
    |    └── exp_01.json
    └── the_awesome_exp
         ├── the_awesome_exp.h5
         └── the_awesome_exp.json