How to easily plot CTA IRF requirements and performances
CTA performances are up-to-date and public and can be found on the cta-observatory website
[1]:
import ctaplot
from ctaplot.io.dataset import get
import numpy as np
import matplotlib.pyplot as plt

%matplotlib inline

ctaplot.set_style('notebook')
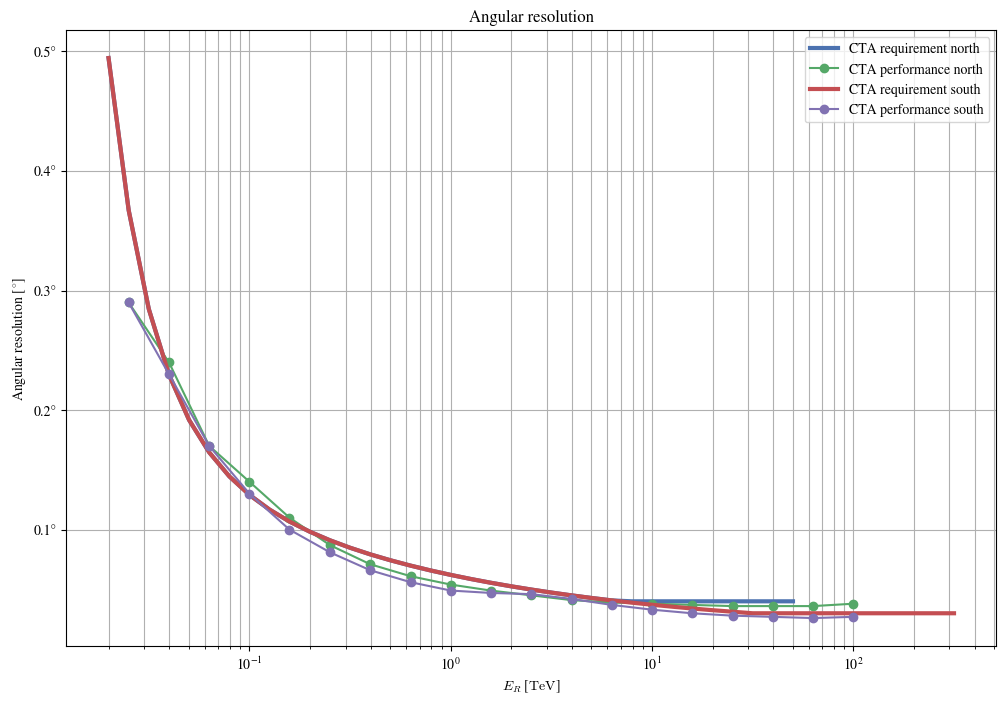
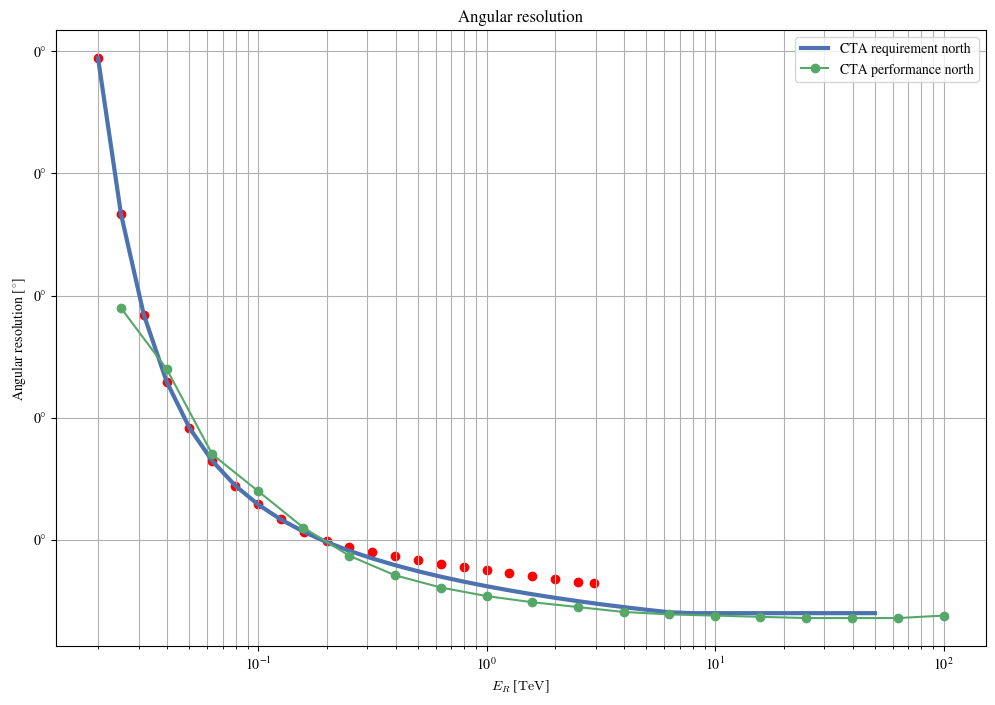
Angular resolution
[2]:
fig, ax = plt.subplots(figsize=(12,8))
ax = ctaplot.plot_angular_resolution_cta_requirement('north', ax=ax, linewidth=3)
ax = ctaplot.plot_angular_resolution_cta_performance('north', ax=ax, marker='o')
ax = ctaplot.plot_angular_resolution_cta_requirement('south', ax=ax,  linewidth=3)
ax = ctaplot.plot_angular_resolution_cta_performance('south', ax=ax, marker='o')
plt.show()
/home/docs/checkouts/readthedocs.org/user_builds/ctaplot/envs/latest/lib/python3.11/site-packages/ctaplot/plots/plots.py:729: UserWarning: This axis already has a converter set and is updating to a potentially incompatible converter
  ax.plot(e_cta, ar_cta, **kwargs)
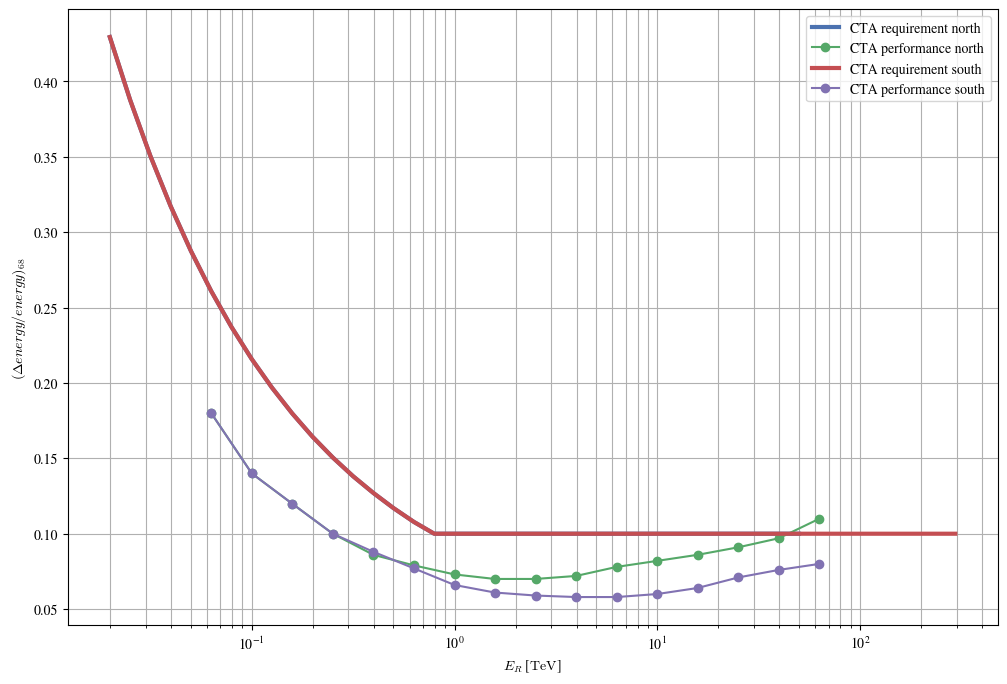
Energy resolution
[3]:
fig, ax = plt.subplots(figsize=(12,8))
ax = ctaplot.plot_energy_resolution_cta_requirement('north', ax=ax, linewidth=3)
ax = ctaplot.plot_energy_resolution_cta_performance('north', ax=ax, marker='o')
ax = ctaplot.plot_energy_resolution_cta_requirement('south', ax=ax,  linewidth=3)
ax = ctaplot.plot_energy_resolution_cta_performance('south', ax=ax, marker='o')
plt.show()
/home/docs/checkouts/readthedocs.org/user_builds/ctaplot/envs/latest/lib/python3.11/site-packages/ctaplot/plots/plots.py:1012: UserWarning: This axis already has a converter set and is updating to a potentially incompatible converter
  ax.plot(e_cta, ar_cta, **kwargs)
/home/docs/checkouts/readthedocs.org/user_builds/ctaplot/envs/latest/lib/python3.11/site-packages/ctaplot/plots/plots.py:979: UserWarning: This axis already has a converter set and is updating to a potentially incompatible converter
  ax.plot(e_cta, ar_cta, **kwargs)
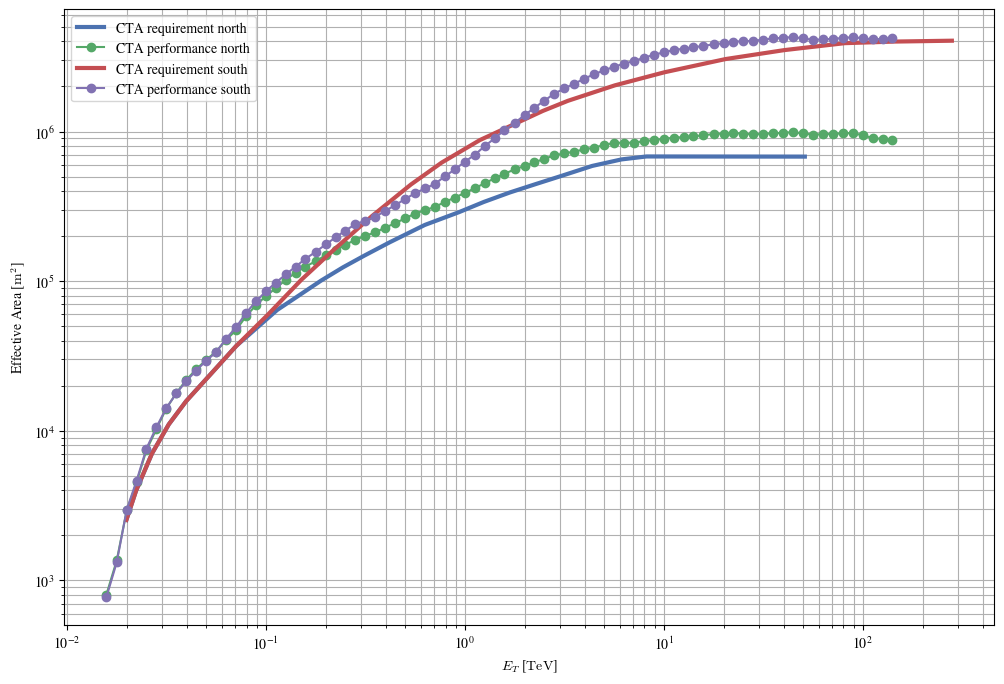
Effective Area
[4]:
fig, ax = plt.subplots(figsize=(12,8))
ax = ctaplot.plot_effective_area_cta_requirement('north', ax=ax, linewidth=3)
ax = ctaplot.plot_effective_area_cta_performance('north', ax=ax, marker='o')
ax = ctaplot.plot_effective_area_cta_requirement('south', ax=ax,  linewidth=3)
ax = ctaplot.plot_effective_area_cta_performance('south', ax=ax, marker='o')
plt.show()
/home/docs/checkouts/readthedocs.org/user_builds/ctaplot/envs/latest/lib/python3.11/site-packages/ctaplot/plots/plots.py:489: UserWarning: This axis already has a converter set and is updating to a potentially incompatible converter
  ax.plot(e_cta, ef_cta, **kwargs)
/home/docs/checkouts/readthedocs.org/user_builds/ctaplot/envs/latest/lib/python3.11/site-packages/ctaplot/plots/plots.py:456: UserWarning: This axis already has a converter set and is updating to a potentially incompatible converter
  ax.plot(e_cta, ef_cta, **kwargs)
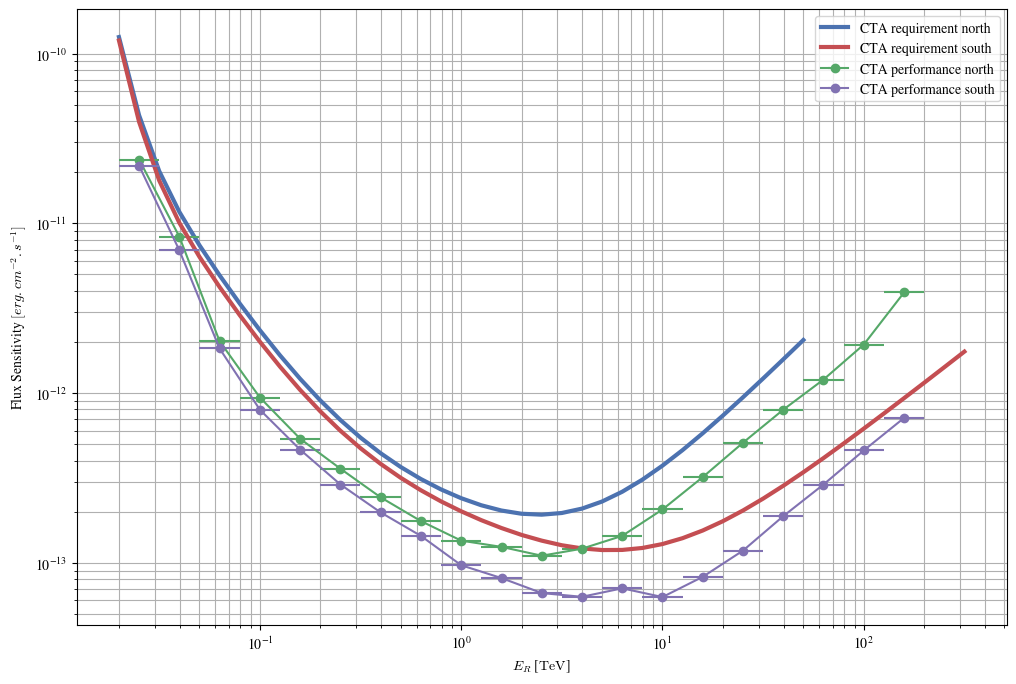
Sensitivity
[5]:
fig, ax = plt.subplots(figsize=(12,8))
ax = ctaplot.plot_sensitivity_cta_requirement('north', ax=ax, linewidth=3)
ax = ctaplot.plot_sensitivity_cta_performance('north', ax=ax, marker='o')
ax = ctaplot.plot_sensitivity_cta_requirement('south', ax=ax,  linewidth=3)
ax = ctaplot.plot_sensitivity_cta_performance('south', ax=ax, marker='o')
ax.set_ylabel(r'Flux Sensitivity $[erg.cm^{-2}.s^{-1}]$')
plt.show()
/home/docs/checkouts/readthedocs.org/user_builds/ctaplot/envs/latest/lib/python3.11/site-packages/ctaplot/plots/plots.py:558: UserWarning: This axis already has a converter set and is updating to a potentially incompatible converter
  ax.errorbar(e_cta, ef_cta, xerr=u.Quantity([e_cta - e_bin[:-1], e_bin[1:] - e_cta]), **kwargs)
/home/docs/checkouts/readthedocs.org/user_builds/ctaplot/envs/latest/lib/python3.11/site-packages/ctaplot/plots/plots.py:523: UserWarning: This axis already has a converter set and is updating to a potentially incompatible converter
  ax.plot(e_cta, ef_cta, **kwargs)
[ ]:
Sub-arrays
[6]:
lst_north_angres_requirements = np.loadtxt(get('cta_requirements_North-50h-LST-AngRes.dat'))
[7]:
fig, ax = plt.subplots(figsize=(12,8))
ax = ctaplot.plot_angular_resolution_cta_requirement('north', ax=ax, linewidth=3)
ax = ctaplot.plot_angular_resolution_cta_performance('north', ax=ax, marker='o')
ax.scatter(lst_north_angres_requirements[:,0], lst_north_angres_requirements[:,1],
           label="LST North requirements",
           color='red')
plt.show()
[ ]: