ctaplot styles
ctaplot comes with different styles, based on seaborn-deep with a couple adjustements.
notebook
slides
paper
On can set ctaplot plot style easily with ctaplot.set_style(). Or use the context manager.
[1]:
import ctaplot
import matplotlib.pyplot as plt
import matplotlib as mpl

%matplotlib inline
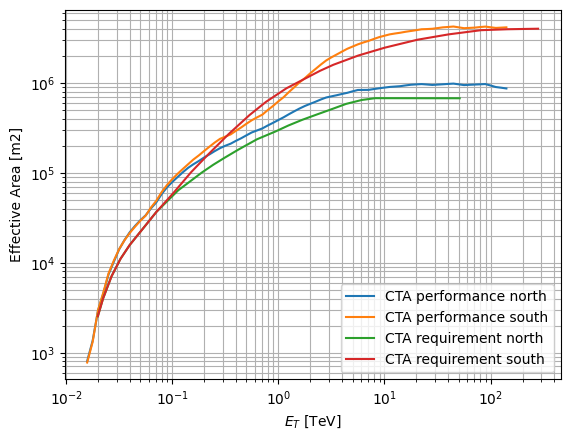
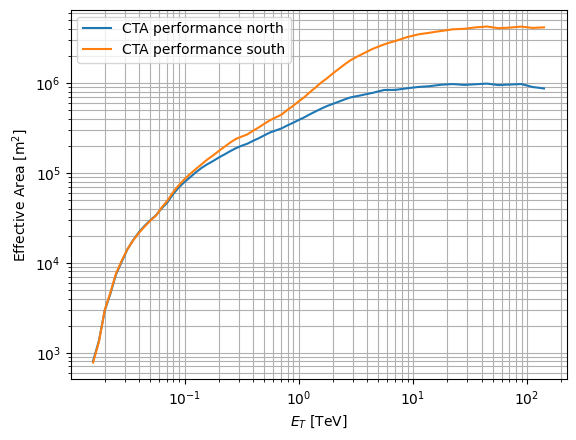
Default matplotlib style
[2]:
mpl.rcParams.update(mpl.rcParamsDefault)

ctaplot.plot_effective_area_cta_performance('north')
ctaplot.plot_effective_area_cta_performance('south')
ctaplot.plot_effective_area_cta_requirement('north')
ctaplot.plot_effective_area_cta_requirement('south')
plt.show()
/home/docs/checkouts/readthedocs.org/user_builds/ctaplot/envs/latest/lib/python3.11/site-packages/ctaplot/plots/plots.py:489: UserWarning: This axis already has a converter set and is updating to a potentially incompatible converter
  ax.plot(e_cta, ef_cta, **kwargs)
/home/docs/checkouts/readthedocs.org/user_builds/ctaplot/envs/latest/lib/python3.11/site-packages/ctaplot/plots/plots.py:456: UserWarning: This axis already has a converter set and is updating to a potentially incompatible converter
  ax.plot(e_cta, ef_cta, **kwargs)
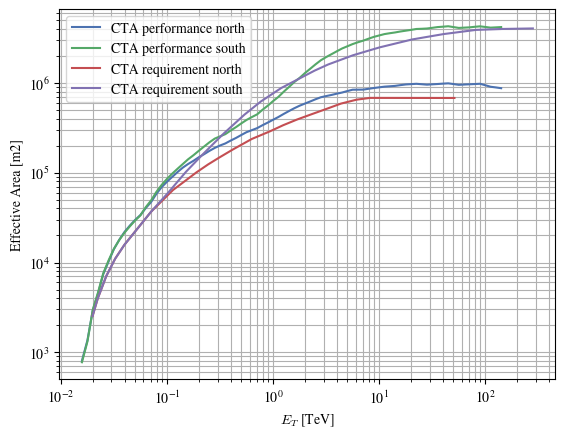
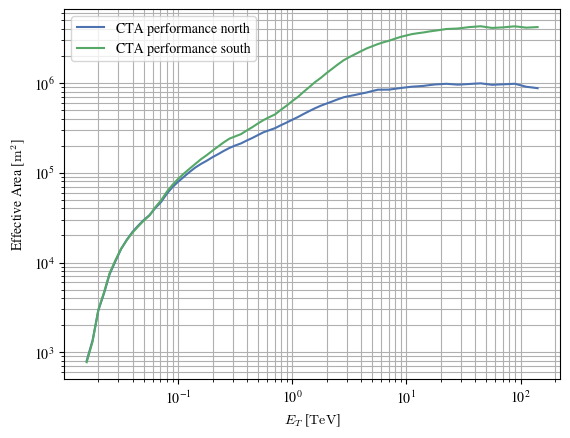
notebook style
larger figures
no LaTeX distribution required (faster to plot)
[3]:
ctaplot.set_style('notebook')
[4]:
ctaplot.plot_effective_area_cta_performance('north')
ctaplot.plot_effective_area_cta_performance('south')
ctaplot.plot_effective_area_cta_requirement('north')
ctaplot.plot_effective_area_cta_requirement('south')
plt.show()
/home/docs/checkouts/readthedocs.org/user_builds/ctaplot/envs/latest/lib/python3.11/site-packages/ctaplot/plots/plots.py:489: UserWarning: This axis already has a converter set and is updating to a potentially incompatible converter
  ax.plot(e_cta, ef_cta, **kwargs)
/home/docs/checkouts/readthedocs.org/user_builds/ctaplot/envs/latest/lib/python3.11/site-packages/ctaplot/plots/plots.py:456: UserWarning: This axis already has a converter set and is updating to a potentially incompatible converter
  ax.plot(e_cta, ef_cta, **kwargs)
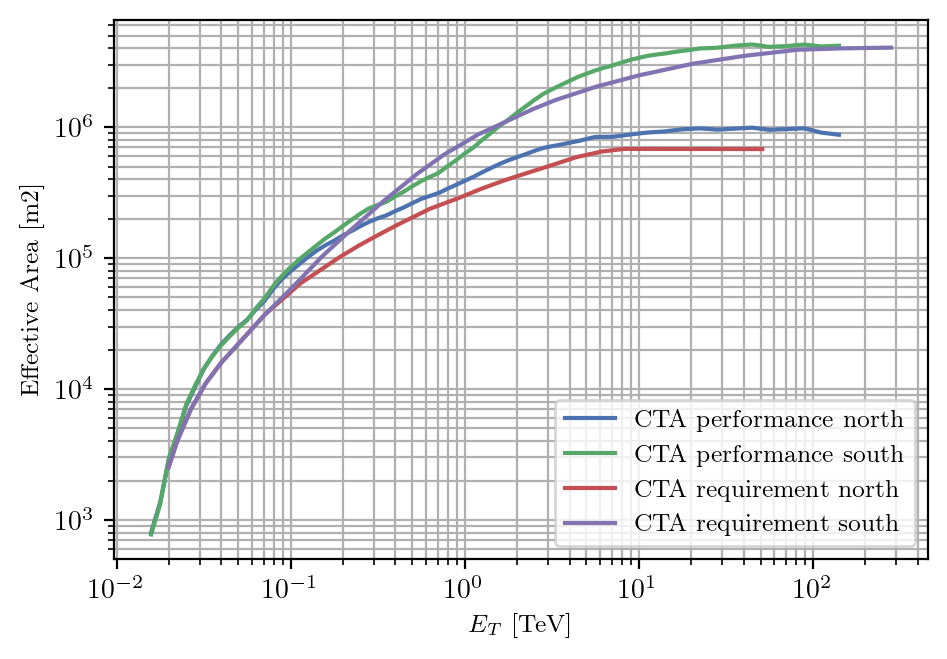
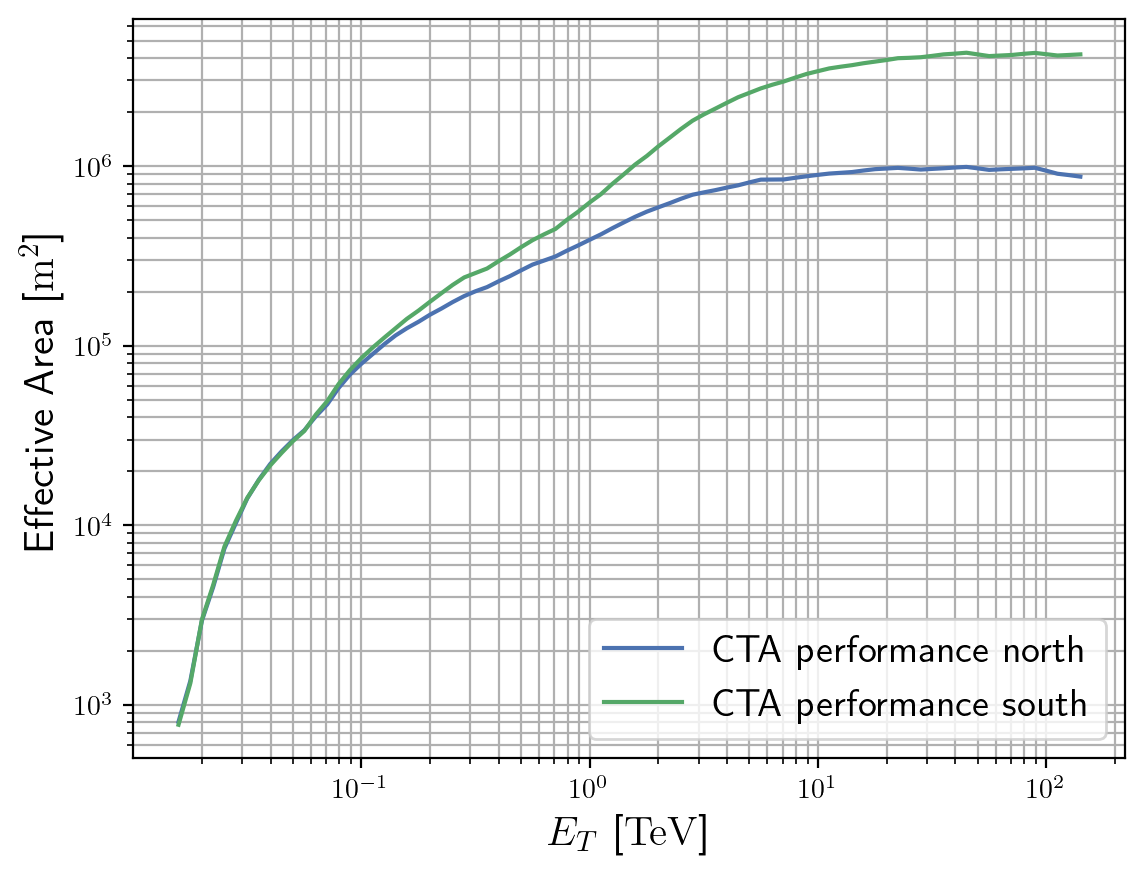
Slides style
larger figures
LaTeX distribution used if available (longer to plot)
[5]:
mpl.rcParams.update(mpl.rcParamsDefault)
ctaplot.set_style('slides')
[6]:
ctaplot.plot_effective_area_cta_performance('north')
ctaplot.plot_effective_area_cta_performance('south')
ctaplot.plot_effective_area_cta_requirement('north')
ctaplot.plot_effective_area_cta_requirement('south')
plt.show()
/home/docs/checkouts/readthedocs.org/user_builds/ctaplot/envs/latest/lib/python3.11/site-packages/ctaplot/plots/plots.py:489: UserWarning: This axis already has a converter set and is updating to a potentially incompatible converter
  ax.plot(e_cta, ef_cta, **kwargs)
/home/docs/checkouts/readthedocs.org/user_builds/ctaplot/envs/latest/lib/python3.11/site-packages/ctaplot/plots/plots.py:456: UserWarning: This axis already has a converter set and is updating to a potentially incompatible converter
  ax.plot(e_cta, ef_cta, **kwargs)
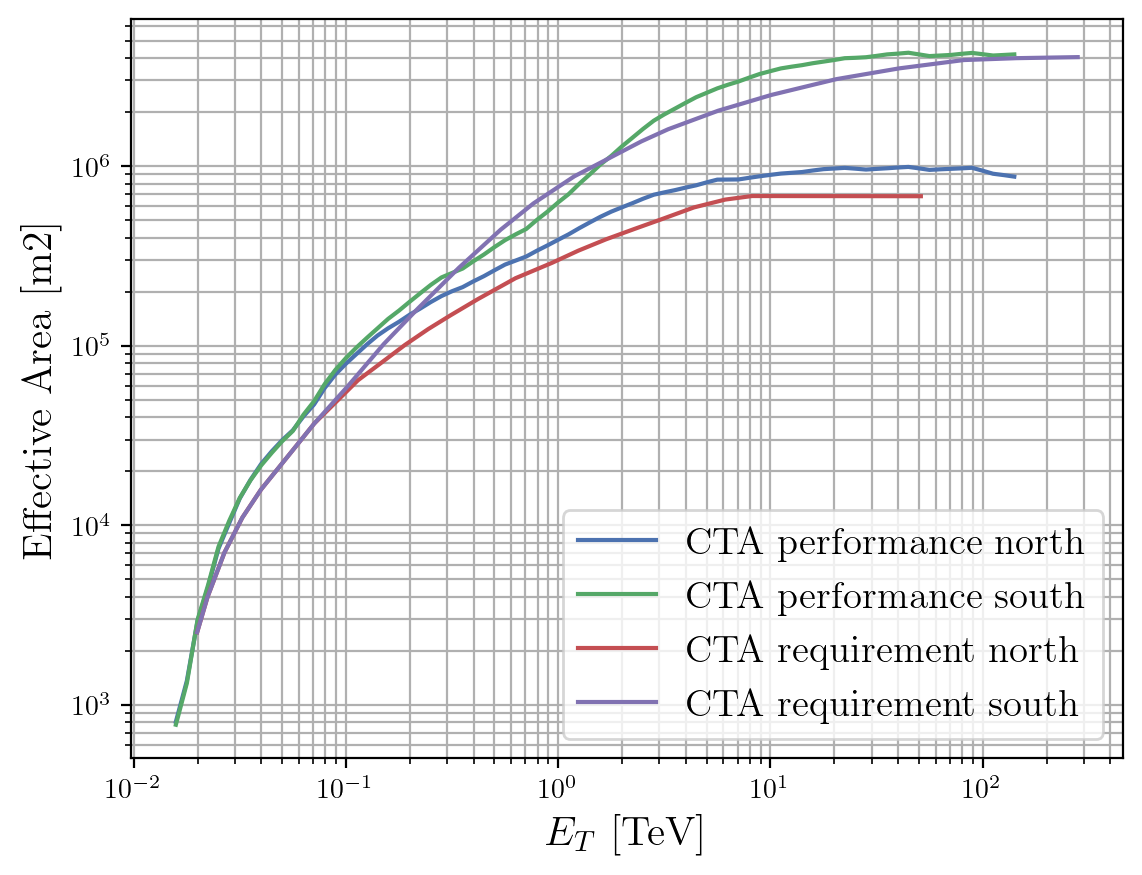
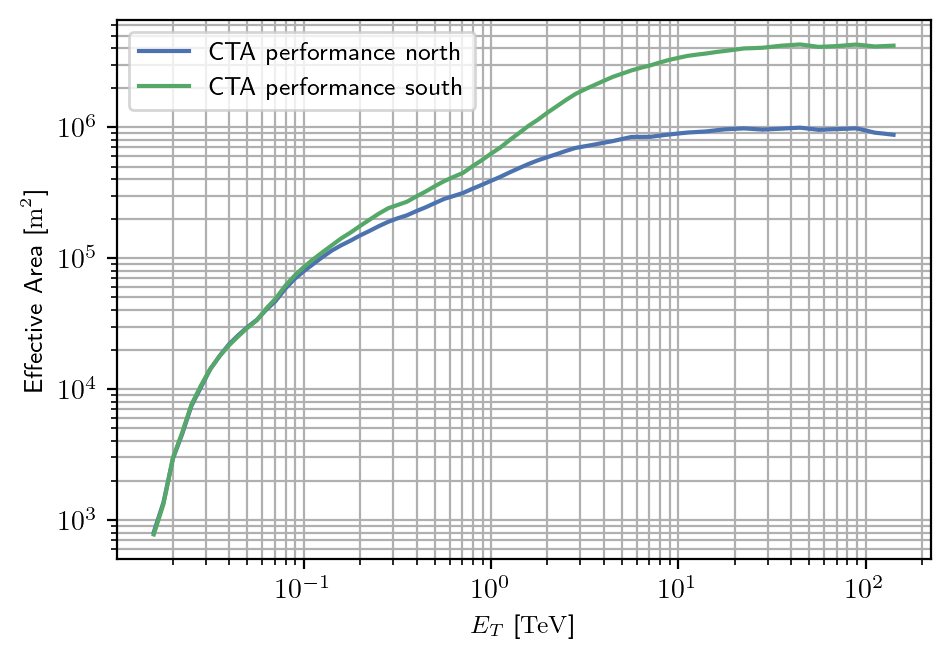
Paper style
LaTeX distribution used if available (longer to plot)
plots with a width equal to one column in two-columns articles
[7]:
mpl.rcParams.update(mpl.rcParamsDefault)
ctaplot.set_style('paper')
[8]:
ctaplot.plot_effective_area_cta_performance('north')
ctaplot.plot_effective_area_cta_performance('south')
ctaplot.plot_effective_area_cta_requirement('north')
ctaplot.plot_effective_area_cta_requirement('south')
plt.show()
/home/docs/checkouts/readthedocs.org/user_builds/ctaplot/envs/latest/lib/python3.11/site-packages/ctaplot/plots/plots.py:489: UserWarning: This axis already has a converter set and is updating to a potentially incompatible converter
  ax.plot(e_cta, ef_cta, **kwargs)
/home/docs/checkouts/readthedocs.org/user_builds/ctaplot/envs/latest/lib/python3.11/site-packages/ctaplot/plots/plots.py:456: UserWarning: This axis already has a converter set and is updating to a potentially incompatible converter
  ax.plot(e_cta, ef_cta, **kwargs)
Context management
You can also use the context manager to change the style temporarily.
[9]:
# Let's reset the style to the default one first

import matplotlib as mpl
mpl.rcParams.update(mpl.rcParamsDefault)
ctaplot.plot_effective_area_cta_performance('north')
ctaplot.plot_effective_area_cta_performance('south')
plt.show()
/home/docs/checkouts/readthedocs.org/user_builds/ctaplot/envs/latest/lib/python3.11/site-packages/ctaplot/plots/plots.py:489: UserWarning: This axis already has a converter set and is updating to a potentially incompatible converter
  ax.plot(e_cta, ef_cta, **kwargs)
[10]:
with ctaplot.plots.style.context('notebook'):
    ctaplot.plot_effective_area_cta_performance('north')
    ctaplot.plot_effective_area_cta_performance('south')
plt.show()
/home/docs/checkouts/readthedocs.org/user_builds/ctaplot/envs/latest/lib/python3.11/site-packages/ctaplot/plots/plots.py:489: UserWarning: This axis already has a converter set and is updating to a potentially incompatible converter
  ax.plot(e_cta, ef_cta, **kwargs)
[11]:
with ctaplot.plots.style.context('slides'):
    ctaplot.plot_effective_area_cta_performance('north')
    ctaplot.plot_effective_area_cta_performance('south')
plt.show()
/home/docs/checkouts/readthedocs.org/user_builds/ctaplot/envs/latest/lib/python3.11/site-packages/ctaplot/plots/plots.py:489: UserWarning: This axis already has a converter set and is updating to a potentially incompatible converter
  ax.plot(e_cta, ef_cta, **kwargs)
[12]:
with ctaplot.plots.style.context('paper'):
    ctaplot.plot_effective_area_cta_performance('north')
    ctaplot.plot_effective_area_cta_performance('south')
plt.show()
/home/docs/checkouts/readthedocs.org/user_builds/ctaplot/envs/latest/lib/python3.11/site-packages/ctaplot/plots/plots.py:489: UserWarning: This axis already has a converter set and is updating to a potentially incompatible converter
  ax.plot(e_cta, ef_cta, **kwargs)
[ ]: